
Receptionists in US dental offices earn a median $46,500 a year; two in three adults had a dental exam or cleaning last year; Americans spent $189.2 billion on dental services in 2024; one dentist in six is now affiliated with a DSO; and 39% of Spanish speakers say they speak English less than “very well.” Every figure below links to its source.
By Viktoria Mols, CMO · Published October 30, 2026 · 10 min read
Most dental "statistics" pages repeat the same handful of numbers from vendor blogs, each citing another vendor blog, until nobody can say where a figure came from or what year it describes. This page takes the opposite approach: every number below comes from the organization that measured it — a federal agency, the ADA's research institute, a national survey — and links to it, with the period it covers.
It is written for practice owners and office managers making decisions about the front desk: what staff cost, how many patients you are competing for, who pays, and which patients need to be served in Spanish. Where a figure matters for the front desk, a sentence under it says why.
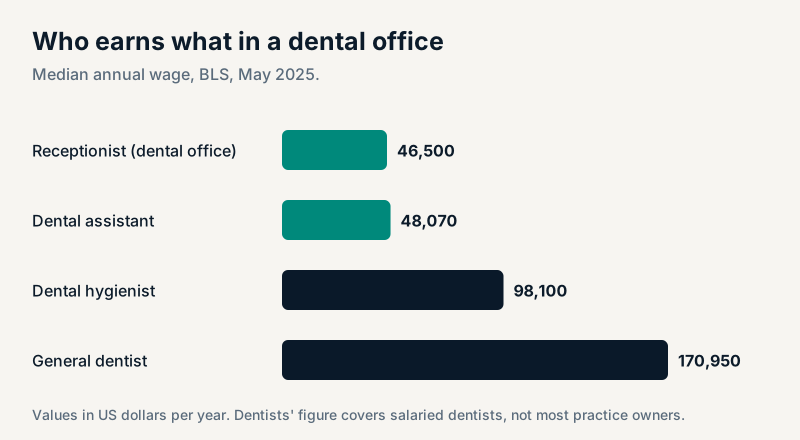
A receptionist in a dental office earns a median $22.36 an hour, close to a dental assistant and less than half of a hygienist (BLS, May 2025). There were 69,930 of them working in dental offices, against 387,790 dental assistants and 222,740 hygienists nationwide. Wages are only part of the cost: across US private industry, benefits make up 30% of total compensation (BLS ECEC, Q2 2026).
Why it matters at the desk: of the four roles here, the front desk is the lowest paid — and it is the one every new patient talks to first. What a hire costs once benefits and taxes are included is worked through in what a dental receptionist really costs.
Two in three adults — 66.7% — had a dental exam or cleaning in the past year, according to the 2025 National Health Interview Survey (CDC/NCHS). For children aged 2 to 17 the figure was 86.9% in 2019. One adult in five aged 20 to 64 has at least one untreated cavity (CDC), and 13.2% of adults 65 and older have lost all their teeth.
Why it matters at the desk: the third of adults who did not have a visit last year includes your own lapsed patients. That is what recall and reactivation work is for — and the words to use at each stage are in dental recall scripts and templates.
Americans spent $189.2 billion on dental services in 2024, up 6.6% on the year, about 4% of the $5.3 trillion national health bill (CMS, 2024). Out-of-pocket spending on dental care grew 5.8% in 2024. Meanwhile, about 284 million Americans — 83% of the population — had some form of dental benefit, 2.3% fewer than the year before (NADP, December 2025).
Why it matters at the desk: more of the bill is coming out of patients' own pockets, and coverage is shrinking. Expect more price questions on the phone, and answer them plainly — how to handle "do you take my insurance?" and "how much is a cleaning?" without a wrong promise is covered in the new patient phone script.
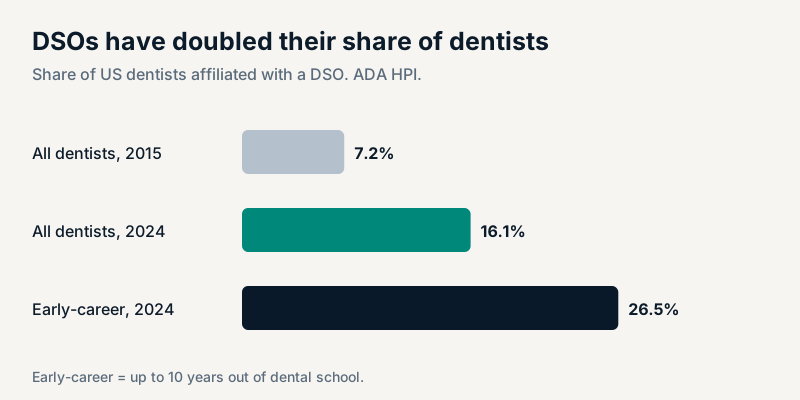
The US had 59.5 dentists per 100,000 people in 2024, ranging from 40.2 in Arkansas to 103.2 in the District of Columbia (ADA HPI, 2025). One dentist in six — 16.1% — was affiliated with a dental support organization in 2024, more than double the 7.2% of 2015; among dentists up to ten years out of school it was 26.5%.
Why it matters at the desk: independent practices increasingly compete with groups that run centralized phone teams and extended hours. Matching that coverage does not have to mean matching their headcount — the options are compared in a day of calls at a dental office.
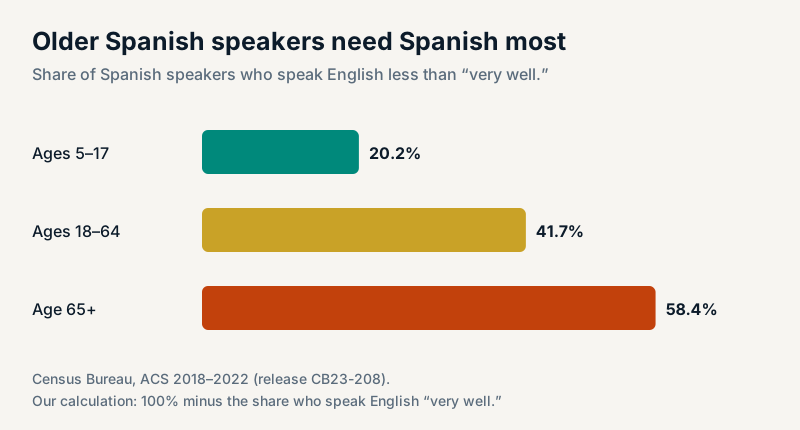
In 2018–2022, 78.3% of people aged 5 and older spoke only English at home, and Spanish accounted for 61.1% of everyone who spoke another language (Census Bureau). By our calculation from those two figures, about 13% of the population aged 5 and older speaks Spanish at home. Among them, 61.0% speak English "very well" — which means about 39% do not — and among Spanish speakers aged 65 and older, only 41.6% do.
Why it matters at the desk: the patients most likely to need Spanish on the phone are the older ones — the same patients most likely to need dentures, crowns and regular care. Phrases and vocabulary for those calls are in the front office glossary in English and Spanish.
98% of US adults own a cellphone and 91% own a smartphone; among Hispanic adults, 92% own a smartphone (Pew Research Center, 2026).
Why it matters at the desk: nearly every patient can call and text from wherever they are — including at lunch, on the way home and after 5, which is exactly when most front desks can't answer.
There is no federal statistic for how many calls a dental office misses, how many of them are new patients, or what share of callers hang up without leaving a voicemail. Figures on those questions circulate widely, but they come from vendor studies of their own customers and are not comparable from one practice to the next. We have left them out of this page on purpose. The most reliable number about your own phones is in your own call log; how to read it in half an hour is described in a day of calls at a dental office, and what the misses are worth under stated assumptions is in how much missed calls cost a dental practice.
National figures set the scene; yours make the decision. Tomorrow, pull three:
| Area | Figure | Value | Period | Source |
|---|---|---|---|---|
| Staff | Median annual wage, receptionists in dental offices | $46,500 ($22.36/hour) | May 2025 | BLS, OEWS, Offices of Dentists, May 2025 |
| Staff | Receptionists employed in dental offices | 69,930 | May 2025 | BLS, OEWS, Offices of Dentists, May 2025 |
| Staff | Median annual wage, dental assistants | $48,070 | May 2025 | BLS, Occupational Employment and Wage Statistics, May 2025 |
| Staff | Dental assistants employed | 387,790 | May 2025 | BLS, Occupational Employment and Wage Statistics, May 2025 |
| Staff | Median annual wage, dental hygienists | $98,100 | May 2025 | BLS, Occupational Employment and Wage Statistics, May 2025 |
| Staff | Dental hygienists employed | 222,740 | May 2025 | BLS, Occupational Employment and Wage Statistics, May 2025 |
| Staff | Median annual wage, general dentists | $170,950 | May 2025 | BLS, Occupational Employment and Wage Statistics, May 2025 |
| Staff | General dentists employed (salaried; excludes most owners) | 124,390 | May 2025 | BLS, Occupational Employment and Wage Statistics, May 2025 |
| Staff | Benefits as a share of total compensation, US private industry | 30% | Q2 2026 | BLS, Employer Costs for Employee Compensation, Q2 2026 |
| Patients | Adults 18+ with a dental exam or cleaning in the past year | 66.7% | 2025 | CDC/NCHS FastStats: Oral and Dental Health |
| Patients | Children 2–17 with a dental visit in the past year | 86.9% | 2019 | CDC/NCHS FastStats: Oral and Dental Health |
| Patients | Adults 20–64 with at least one untreated cavity | 21% | 2017–Mar 2020 | CDC, Fast Facts: Cavities |
| Patients | Adults 65+ with complete tooth loss | 13.2% | 2017–Mar 2020 | CDC/NCHS FastStats: Oral and Dental Health |
| Money | US spending on dental services | $189.2 billion (+6.6%) | 2024 | CMS, National Health Expenditures 2024 Highlights |
| Money | Dental services as a share of national health spending | about 4% | 2024 | CMS, National Health Expenditures 2024 Highlights |
| Money | Growth in out-of-pocket dental spending | +5.8% | 2024 | CMS, National Health Expenditures 2024 Highlights |
| Money | Total US national health expenditure | $5.3 trillion (+7.2%) | 2024 | CMS, NHE Fact Sheet |
| Money | Americans with some form of dental benefit | about 284 million — 83% (−2.3%) | 2024 vs 2023 | National Association of Dental Plans, press release, Dec 4, 2025 |
| Practices | Dentists per 100,000 population | 59.5 | 2024 | ADA Health Policy Institute, The U.S. Dentist Workforce (Aug 2025) |
| Practices | Range across states | 40.2 (Arkansas) to 103.2 (D.C.) | 2024 | ADA Health Policy Institute, The U.S. Dentist Workforce (Aug 2025) |
| Practices | Dentists affiliated with a DSO | 16.1% (7.2% in 2015) | 2024 | ADA Health Policy Institute, The U.S. Dentist Workforce (Aug 2025) |
| Practices | Dentists up to 10 years out of school affiliated with a DSO | 26.5% | 2024 | ADA Health Policy Institute, The U.S. Dentist Workforce (Aug 2025) |
| Language | People 5+ who speak only English at home | 78.3% | 2018–2022 | U.S. Census Bureau, release CB23-208 (ACS 2018–2022) |
| Language | Spanish speakers who speak English “very well” | 61.0% | 2018–2022 | U.S. Census Bureau, release CB23-208 (ACS 2018–2022) |
| Language | Spanish speakers 65+ who speak English “very well” | 41.6% | 2018–2022 | U.S. Census Bureau, release CB23-208 (ACS 2018–2022) |
| Phones | US adults who own a smartphone | 91% (cellphone: 98%) | 2026 | Pew Research Center, Mobile Fact Sheet (survey Jan–Jun 2026) |
| Phones | Hispanic adults who own a smartphone | 92% | 2026 | Pew Research Center, Mobile Fact Sheet (survey Jan–Jun 2026) |
You are welcome to use these figures. Please cite the original source linked in the table, and if useful, this compilation: "Dental front office statistics for 2026, from primary sources only", Dentovox, checked October 30, 2026, https://dentovox.com/blog/dental-front-office-statistics/. Spotted a figure that has been updated at the source? Tell us at info@dentovox.com.
For May 2025, median annual wages were $46,500 for receptionists in dental offices, $48,070 for dental assistants, $98,100 for dental hygienists and $170,950 for salaried general dentists (Bureau of Labor Statistics).
66.7% of adults aged 18 and older had a dental exam or cleaning in the past year, according to the 2025 National Health Interview Survey reported by CDC/NCHS. For children aged 2 to 17 the figure was 86.9% in 2019.
$189.2 billion in 2024, up 6.6% from 2023, according to CMS national health expenditure data — about 4% of total US health spending of $5.3 trillion.
16.1% of US dentists were affiliated with a dental support organization in 2024, up from 7.2% in 2015, according to the ADA Health Policy Institute. Among dentists up to ten years out of school, the share was 26.5%.
About 13% of people aged 5 and older speak Spanish at home (our calculation from Census 2018–2022 figures), and 39% of Spanish speakers report speaking English less than “very well” — rising to about 58% among those 65 and older.
No. Figures on missed-call rates come from vendor studies of their own customers, not from a public statistical source. Your own phone system's call log, grouped by hour, is the most reliable measure for your practice.
Create an account free — no card — build your receptionist, and hear it handle a call on the spot. Your own number activates when you start a plan.